Showing posts with label Usd Cad. Show all posts
Showing posts with label Usd Cad. Show all posts
Thursday, July 18, 2013
Monday, May 13, 2013
Friday, May 10, 2013
Tuesday, May 7, 2013
Monday, January 7, 2013
Monday, December 10, 2012
Wednesday, November 21, 2012
Tuesday, October 23, 2012
Tuesday, October 16, 2012
Monday, October 8, 2012
Friday, October 5, 2012
Thursday, September 13, 2012
Friday, September 7, 2012
Tuesday, August 7, 2012
Thursday, July 26, 2012
USDCAD H1 Chart Update
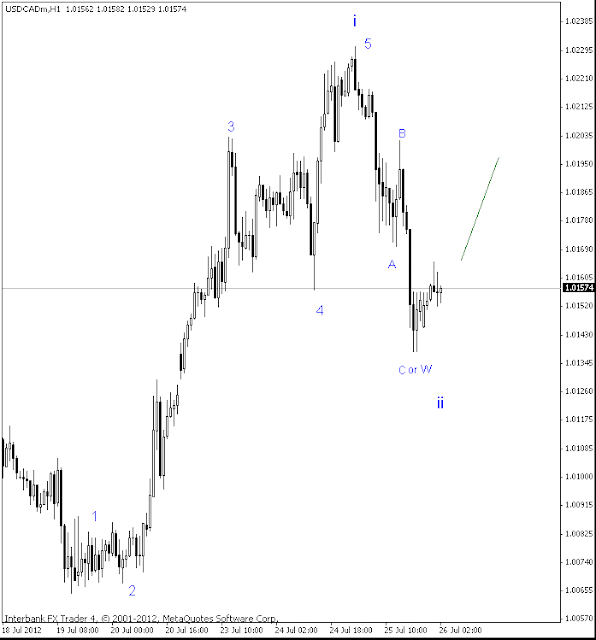
There are 2 possible count for corrective wave..
1.) First is same count as show in above chart. ABC corrective waves(zigzag) are formed and we are in bull impulse waves.
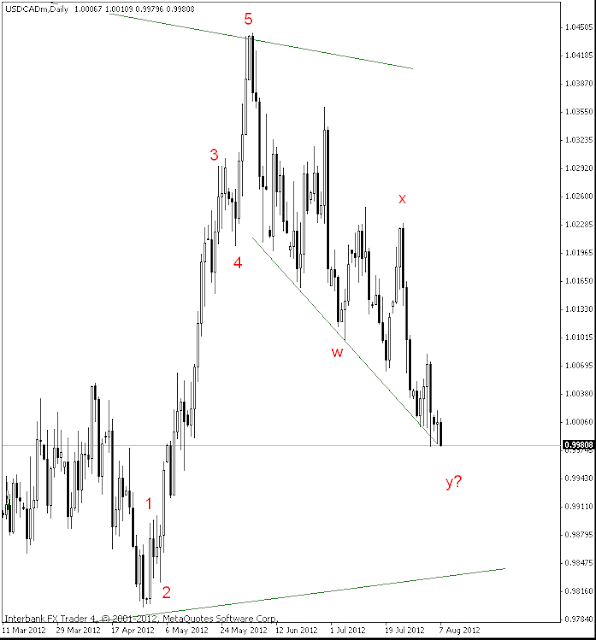
2.) 2nd possible wave count, corrective zigzag waves are large wave W and we may see down movement for wave X and wave Y.
Wednesday, July 25, 2012
USDCAD Elliott Wave Analysis
If you see hourly chart for USDCAD, 5 impulse waves has been completed at 1.023 from 1. 1.006. Corrective wave A has also formed and now are in wave B.. Its good to enter the trade to ride wave C to somewhere around 1.014 ~ 1.013
Sunday, July 22, 2012
Sunday, July 15, 2012
Monday, March 12, 2012
Subscribe to:
Posts (Atom)


