Showing posts with label USD INR. Show all posts

Thursday, September 10, 2020

SPOT TREND REVERSAL NIFTY BANKNIFTY AUTO IT MIDCAP METAL PHARMA GOLD SILVER DOLLAR

  Hi Firends,

In this Video I have given update on Nifty, Bank Nifty, Auto, IT, Mid Cap, Metal, Pharma and Gold & Silver and Dollar Index. Overall the correction looks over and there should be a strong Rally across Asset classes.


Learn to Invest & Trade Like Professionals 

Process of identifying Opportunities based on Technical Analysis via Scans 

High Probability Trade Set Up that works on various Asset Classes & Time Frames 


About Webinar 

https://rb.gy/yz4kft 


Access Recording below

https://imjo.in/bqGjtt


Follow me on 

Telegram Channel 


Twitter Profile   @HarshDixit84 


Facebook Page 


Instagram 


Thanks & Regards,

Harsh Dixit.

Friday, July 3, 2020

NIFTY BANKNIFTY USD/INR RELIANCE

Hi Friends,

In this video I have shared my updated Elliott Wave count on Nifty. Wave count on BankNifty. Analysis on USDINR. And trading set up on Reliance industries.


Thanks & Regards,

Harsh Dixit.

Sunday, July 20, 2014

USDINR Elliott Wave


Looks like Corrective pattern - Double Zigzag Wave Y in formation now, which might go till 61.45 - Fibo62% target.

But need to wait and see formation for Sub-wave for Wave Y.

Wednesday, May 8, 2013

USD/INR By Harsh


USD/INR May trade in Range of 53.90-54.90 for few more weeks & once it breaks out of he triangle it is likely to head to 59-60 within next 3-5 months


Friday, April 12, 2013

USDINR - Technical Update

  1. Nothing new here, almost everyone interested in USDINR know that prices are into a coiling pattern.
  2. Its a matter of time before we get a resolution.
  3. One point to note though, since this has been a prolonged correction, the resolution may seem to take forever, and may include many futile attempts by eager traders to catch the much anticipated breakout or breakdown.
  4. My suggestion is its okay to let go of first few points, because there would be a long way to go.
  5. One cautionary note though, since we have traveled so close to the apex, there is a chance that the much awaited BO / BD may fizzle out. 
  6. So, since the anticipation is so high, patience is the key to successfully trading this pattern.

Tuesday, September 11, 2012

USDINR - Elliott Wave Update

4 Hourly Chart
A contracting triangle is forming most probably in wave (b) of [4], as per our preferred count. I am suspecting the last two days strength in USDINR as wave {e} of (b) in the making. The possible target zone for this wave {e} ranges from 55.55-55.65. I would start looking for reversal patterns to the downside once we near this range. 
This consolidation in USDINR has tested everybody's patience, and that is a good thing. Because once we get a resolution of this range, it should be nothing short of explosive, and yes tradable.

Wednesday, September 5, 2012

USDINR - Elliott Wave Update

4 Hourly Chart
We have been discussing about the flag pattern in wave {2} on USDINR in our previous  update, the said pattern did test our patience, but finally today the fag has staged a breakout. Now on the chart above our preferred count suggests that we may rise in wave (c) of [b]. In that case we may test the levels around 56.75. But for that we have to take out first the crucial resistance around 55.97 levels. As soon as we take that out we may see 56.75 on USDINR. I am keeping the SL for the buy trade on BO from the flag at 55.40. So you have a risk of 0.43 against a reward of 0.92, so the reward to risk ratio comes at 2:1, which is not bad.

Note: There are many possibilities at play, I have a tendency to play the most conservative scenario, to keep expectations realistic, and volatility of my trading portfolio minimum.

Saturday, September 1, 2012

USDINR - Elliott Wave Analysis

Monthly Close Only Chart

This is a monthly chart of USDINR. I have tried to cover the latest impulsive pattern on this chart. Which started way back in 1972 around 7 odd levels. Rupee has depreciated consistently and has now reached the levels of 55.50. The price action in the top right corner has followed the channel (blue color), pretty well, which is generally the characteristic of corrective waves. USDINR may be in corrective patten in wave [IV], namely expanded or irregular flat, in that case we are sure to retest the low made by the terminus of wave (A) of [IV] which comes around 39 odd levels. But if we are in an impulsive wave [V] as shown in by the alternate count, we should break out above the upper channel boundary and head much higher.

Weekly Close Only Chart
The daily chart above shows the internal count for both the scenarios. The corrective wave [IV] scenario is my preferred count so far, and is shown by labels without "?" mark after them. And the wave [V] scenario which is my alternate count so far, is shown by wave labels followed by "?" mark.
The first likely support band comes on the 52.70-51.70 range. Below that we may test 49.50-48.50 range. A break below 49.50-48.50 will increase the probability of  corrective wave [IV] scenario considerably.

Note: Since we are tracking the price movements of very large fractals namely Monthly and Weekly time frames, the targets are huge as well. this is an attempt at analyzing USDINR using EWP. Regular short term updates on USDINR, will be covered on trading days.

Thursday, August 30, 2012

USDINR - Elliott Wave Analysis

4 Hourly Chart
This is a 4 hourly chart of USDINR. Again this chart throws at us multiple possibilities. My preferred count is bullish on dollar. Two of three probable counts are bullish, one is bearish. The invalidation of the bearish count is above 56, whereas invalidation for bullish counts is below 55. All levels are for spot USDINR. 
One of the bullish count suggests we may rise till 56.75 in wave (b)?? and then come down in wave (c)?? of [4]??.
Bearish count suggests that we have completed a triangle pattern in wave (b)? and should not come down in waves (c)? of [4]?.
Lastly the preferred count suggests that we have completed triangle in wave [4] and are now rising in wave [5]. We may have completed waves (1)-(2) of [5].

Preferred count - Wave label not followed by anything.
Alternate count I - Wave label followed by ?.
Alternate count II - Wave label followed by ??.

Note: Some readers have a problem with my analysis. The argument is that the "discussion of multiple possibilities in a market tends to be confusing and does not add value". I would like to say, I am just discussing probabilities here, it may sound defensive to some, but its the truth. I have a trading method as everyone who is dabbling in market is expected to have. I use EWP to become aware of different probable scenarios in the markets, and then trade the one which gives me highest "expectation" using my trading method. Now as with many people around me, this concept may be a little hard to digest, or may be plain wrong, for the readers, but I cant help it. If  I sound confusing, then may be I am, but it is preventing me from losing money in the market, I would take that bet any day!


Monday, August 27, 2012

USDINR found some support around 55 levels!

4 Hourly Chart
I had proposed three possible outcomes from this range bound action on USDINR. I feel if we take out 55.92, we might well be on our way to play out the possibility shown on the chart above. Which means we have to take out the top of wave [3] around 57 odd levels, as our minimum target for wave [5]. On the other had if we get resisted around the 55.92 levels, then we may see prices going down to much lower levels, two possibilities were marked on the chart in our last post, refer it here.. We are still in the range of 55.92-55.00, so unless we get a break on the either side, we wont see a price expansion.

Wednesday, August 22, 2012

USDINR indecision continues!

4 Hourly Chart
USDINR as pointed out in our last post is still indecisive, more than a couple of possibilities exists, but the range has now narrowed down to between, 55.92-55.065. A break below the 55.065 level should be good for equities, and conversely a break above the 55.92 levels may suggest some weakness.
An interesting thing to note here is that below 55.065 levels, the possibility of a triangle in wave [4] takes a backseat, it will be postponed to say the least. But if we move up without violating 55.065 and break above the 55.92 levels, the up trend is almost confirmed. If the up move persists after breaking out from 55.92 level, we may even see prices reaching 58-60 range.

Friday, August 17, 2012

USDINR, the "Grind" continues!

Chart 1
This is my working count (Chart 1) so far. It will be, till we take out the top marked at (b). But there are a couple of different possibilities, marked on the charts below. Both the possibilities below are that of possible triangles, but in different waves. The details are discussed below.
Chart 2
This chart (Chart 2) shows a possible triangle in wave {b} of (b). Which means that once it is complete we will have a thrust from the triangle up wards, in wave {c} of (b). Once this wave (b) is done, we should come down, to complete wave (c).
Another way to count the price action is shown below (Chart 3). Here we may be forming a triangle in wave [4] itself, and may be pretty close to completing it. We have to come down a little in wave (e) of [4] before we embark on a thrust from the triangle in wave [5].
Chart 3
So in conclusion, we have two of three counts (Charts 2 and 3) suggesting an up move once the respective triangles are complete, whereas one count (Chart 1) suggesting immediate down move from current levels. The real question however is, how we trade this info at hand? I would share what I would do in such a scenario. Both the triangle scenarios shown above would get violated below 55.065, so as long as this level is protected, the triangle scenarios are possible. I will wait till 55.065 is taken out to initiate short positions, and keep stop loss for earlier short positions at 56.35. To initiate a long position I would wait for the market to come near the lower trend line of the triangles around 55.35-55.25 levels, and then keep a stop loss and reverse of 55.065, to play from the short side if the triangle scenarios are violated.

Trade Elliott Wave

Friday, August 10, 2012

Nifty hits "resistance", and USDINR finds "support"!

Nifty Hourly Chart
This is not an attempt to exemplify the correlation between USDINR and Nifty, but just an observation I am sharing here. I am currently counting a I-II/[1]-[2]/(1)-(2) formation on the chart of Nifty, I am expecting Nifty to breakout from the resistance zone around 5340-50 and rally handsomely towards the 5630 level. On the other hand USDINR, has found some support in the 55.00-55.10 zone. We may see prices touching the 55.60-55.70 zone to complete the wave 2 on the chart below. In USDINR too we have a {1}-{2}/1-2 formation going on, but in exact opposite direction of Nifty. Though we cannot entirely bank on this inverse correlation between Nifty and USDINR, marking waves on charts of both the tickers, indeed help us in better classifying the waves. So right now I am hoping Nifty would resume the up move and USDINR its down move, sooner than later. I would become skeptical of these respective moves, if Nifty trades below 5280-70 band, and USDINR trades above the 55.60-55.70 band, till such time the existing count is intact.
USDINR Hourly Chart
Trade Elliott Wave

Tuesday, August 7, 2012

USDINR - Elliott Wave Analysis


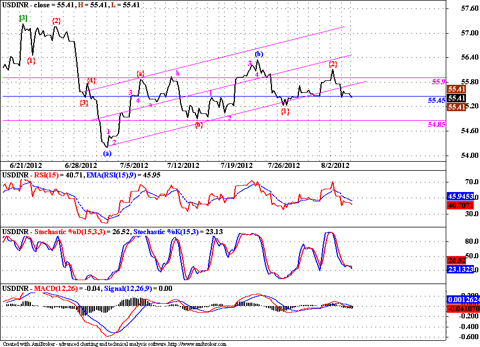
Below is a 4 hourly chart of USDINR. As you can see I was tracking the (B) wave, which seems to be done at 56.41 levels, nicely contained within parallel lines.. Prices then fell in 5 waves in wave {1}, we have also completed wave {2}. Now we can expect a fall in wave {3} of (C), which should be pretty dynamic. We have already breached 55.45 levels, now we need to break 54.85. We may pick up momentum below  55.20 levels.
4 Hourly Chart
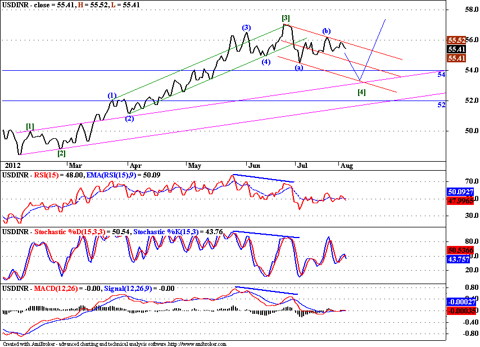
Below is a daily chart of USDINR. We can see that the present consolidation is wave [4]. Post which I am expecting another impulsive advance. Whether it will be the last leg of this stupendous advance which started from 48.445 levels or just waves subdividing on multiple degrees thus targeting much higher levels, remains to be seen. The target for this wave of [4] may be in the 54-52 zone. That should be a good area for initiating long Dollar (USD) positions against Rupee (INR). 
Daily Chart

CTRL + Q to Enable/Disable GoPhoto.it

Thursday, August 2, 2012

USDINR - ElliottWave Analysis

Hourly Chart
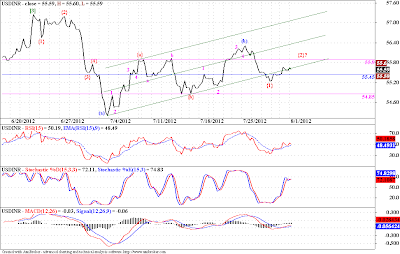
USDINR is closing in on the possible reversal zone, the zone ranges from 55.80-56.00. USDINR should complete wave {2} in this zone. I would short in this range with a stop loss above the beginning of wave {1} at 56.41. On the down side we may start wave {3} which is always the most dynamic wave of any impulse move, and is expected to touch the 54-52 zone. So a risk of 0.40 Paise may give you a reward of 2.00 to 2.40 Rs to a dollar. This gives us Reward to Risk ratio of 5 to 6. I would call it a good trade. So somewhere during today's session or tomorrow, we may get an opportunity in the 55.80-56.00 range.
 

Wednesday, August 1, 2012

USDINR - Elliott Wave Analysis

Daily Chart

This is the daily chart of USDINR, we might be falling in wave (c)of [4]. The target range of this wave [4], may reach the 54-52 range. The prices should follow the down sloping red channel, and should reach the lower boundary of the channel.
The detailed count can be seen on the hourly chart below. We may have completed a zigzag correction in wave (b), and now we are falling in wave (c) of [4]. This rise in INR against USD may result in a spurt in equity prices. For the time being though, we should not trade above the 55.90 levels on the USDINR, to keep this down move intact.
Hourly Chart
Trade Elliott Wave

Friday, July 27, 2012

USDINR - Elliott Wave Analysis

4 hourly
We have been tracking the corrective wave (b) for some time now. It seems to be over. The last leg wave {c} of (b), topped around 56.41. The reason I am saying this is, the USDINR pair has come down, and taken out the top of wave 1 of {c} at 55.45. We know if it is a wave 4 it cannot go below the top of wave 1, and as it has happened, we can say that, this corrective pattern may be over, the least the prices can do now is to reach the low of wave {b} around 54.85 levels. If we break below this level too, then the correction will be deemed complete, and we will test even lower levels in wave (c) of [4]. Please refer the count on longer fractal on the daily chart below. I am looking for a bounce in 3 waves so that I can position myself for the most dynamic part of any impulse, the 3rd wave, wave {3} of (c) in this case.
Daily

Trade Elliott Wave

Wednesday, July 25, 2012

USDINR - Elliott WAve Analysis

Hourly Chart
USDINR was expected to form a corrective pattern, in wave (b), and it has progressed beautifully so far. We thought that the pattern was completed at the 55.93 level on 12th July, but it was actually a part of a flat correction in wave {b} of (b). Now it is also possible that we may start a new up move in wave (5) as a part of our alternate count.  But I always go for the most conservative count, and use trailing stop losses to remain in the trend, as long as it continues. So we have th equality target, i.e. wave {c}=={a} at 56.60. Also fibo retracements of the preceding wave (a) comes in the range of 56.12=56.60. So as we were expecting the prices to trade in this range since a long time now, it has actually happened. The most important thing to do now is to track the internal wave patterns of this wave {c}, which has to be an impulse, and try to find the exact levels for this impulse to terminate. Because what will follow this corrective up move is an impulsive down move in wave (c). Wave (c) being the third wave it is often very severe, hence a good opportunity.
Below I have attached a daily chart, which shows my preferred and alternate counts. Also it shows the possible target area for wave (c) in roughly 54-53 range.
I will be tracking the patterns closely, and will alert when a trading opportunity presents itself.

Daily Chart
Note: This is my first post on the 5WAVES blog, I thank Saranya Vj for providing me with this opportunity to share my views on currencies / pairs on his blog. I also write on my own blog, by the name Trade Elliott Wave, and I track Indian indices and stocks on it.


Trade Elliott Wave