
Below is a 4 hourly chart of USDINR. As you can see I was tracking
the (B) wave, which seems to be done at 56.41 levels, nicely contained
within parallel lines.. Prices then fell in 5 waves in wave {1}, we have
also completed wave {2}. Now we can expect a fall in wave {3} of (C),
which should be pretty dynamic. We have already breached 55.45 levels,
now we need to break 54.85. We may pick up momentum below 55.20 levels.
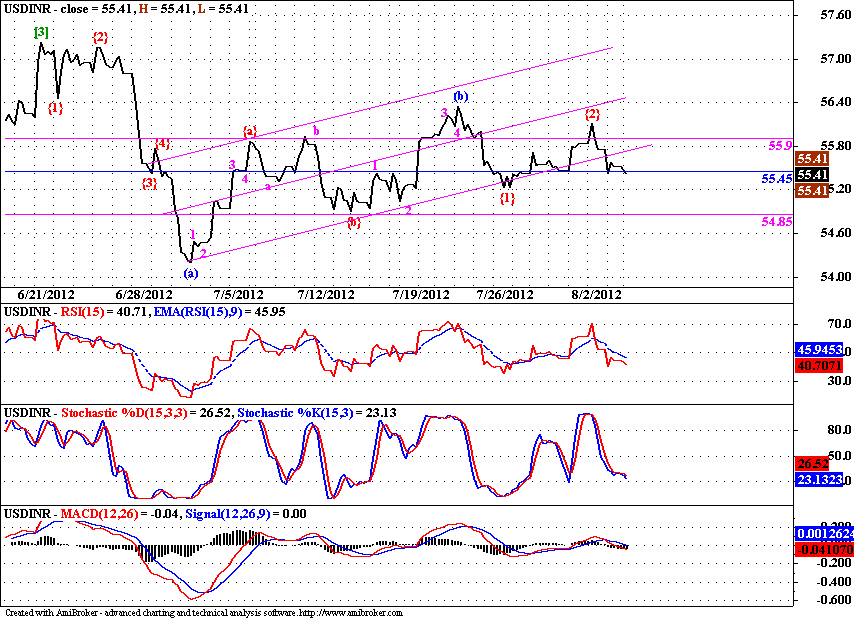 |
| 4 Hourly Chart |
Below
is a daily chart of USDINR. We can see that the present consolidation
is wave [4]. Post which I am expecting another impulsive advance.
Whether it will be the last leg of this stupendous advance which started
from 48.445 levels or just waves subdividing on multiple degrees thus
targeting much higher levels, remains to be seen. The target for this
wave of [4] may be in the 54-52 zone. That should be a good area for
initiating long Dollar (USD) positions against Rupee (INR).
 |
| Daily Chart |
CTRL + Q to Enable/Disable GoPhoto.it

0 comments:
Post a Comment