Fibonacci Clusters and Gann Analysis: Nifty Support and Resistance upcoming days
No Comments


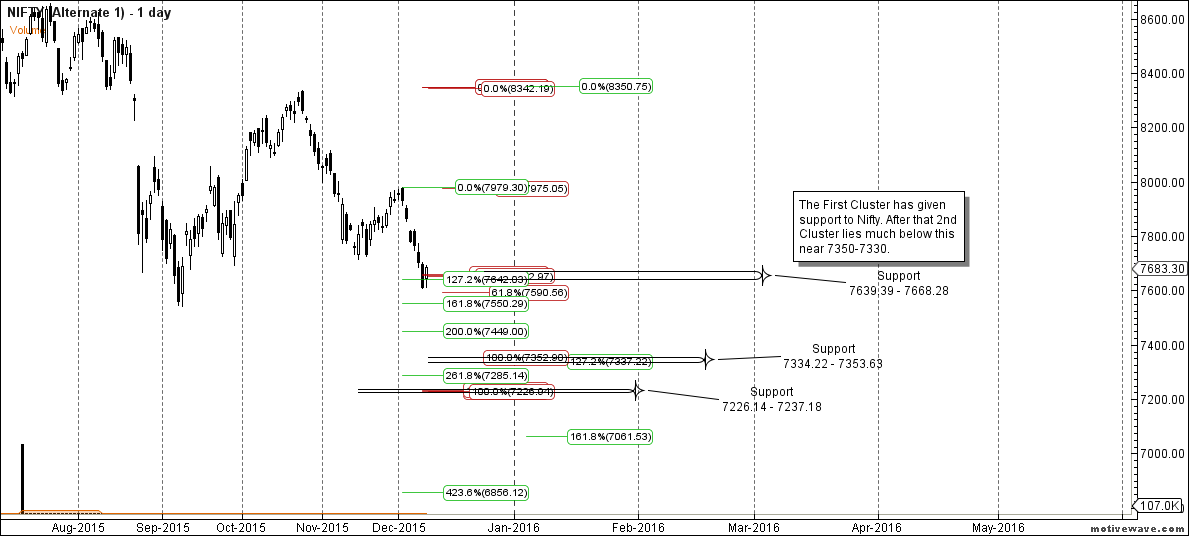
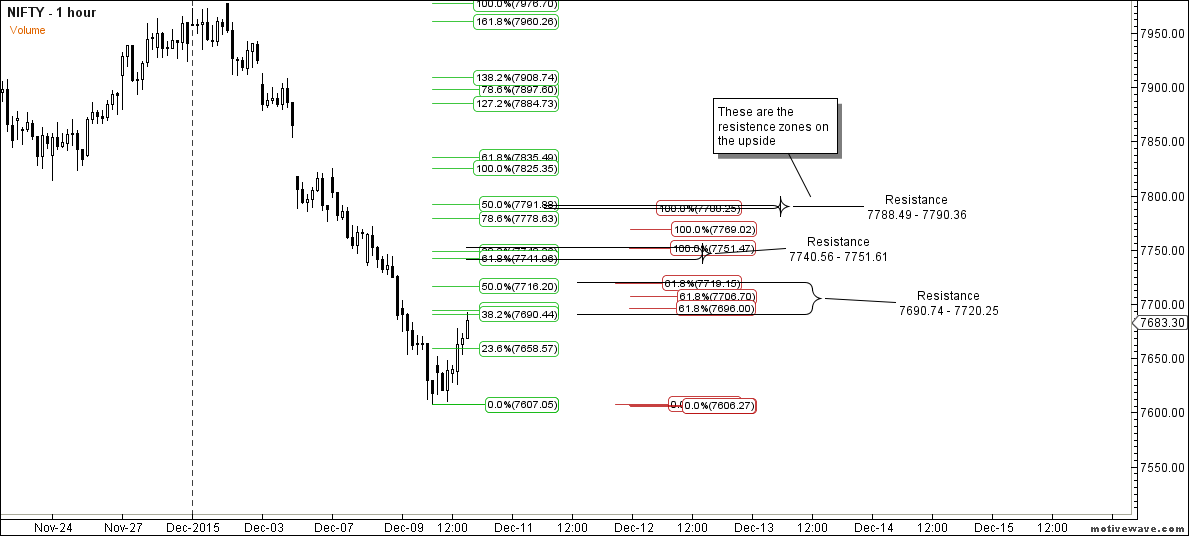
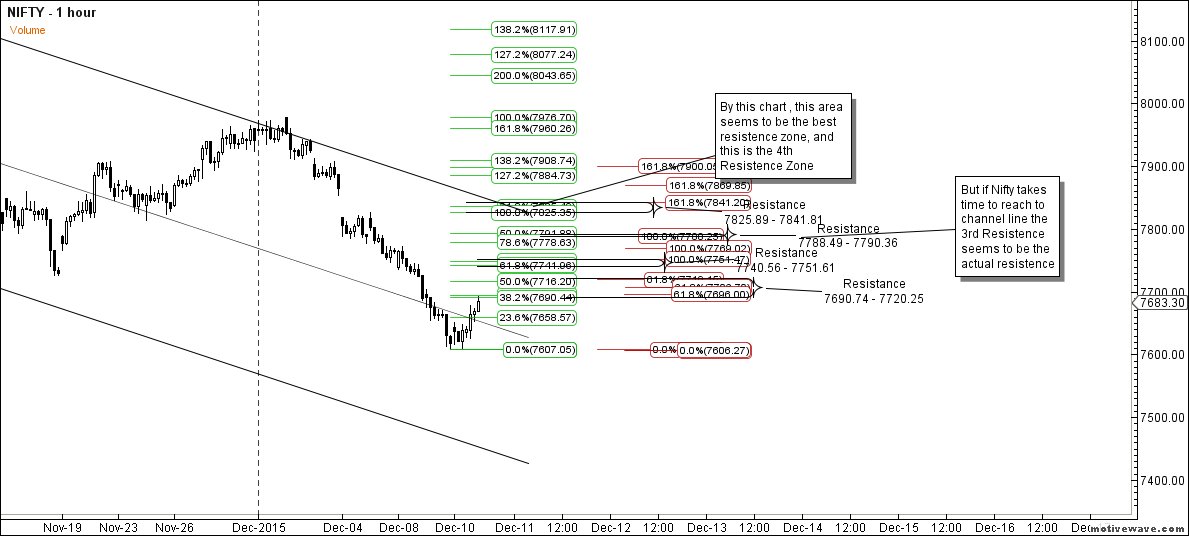
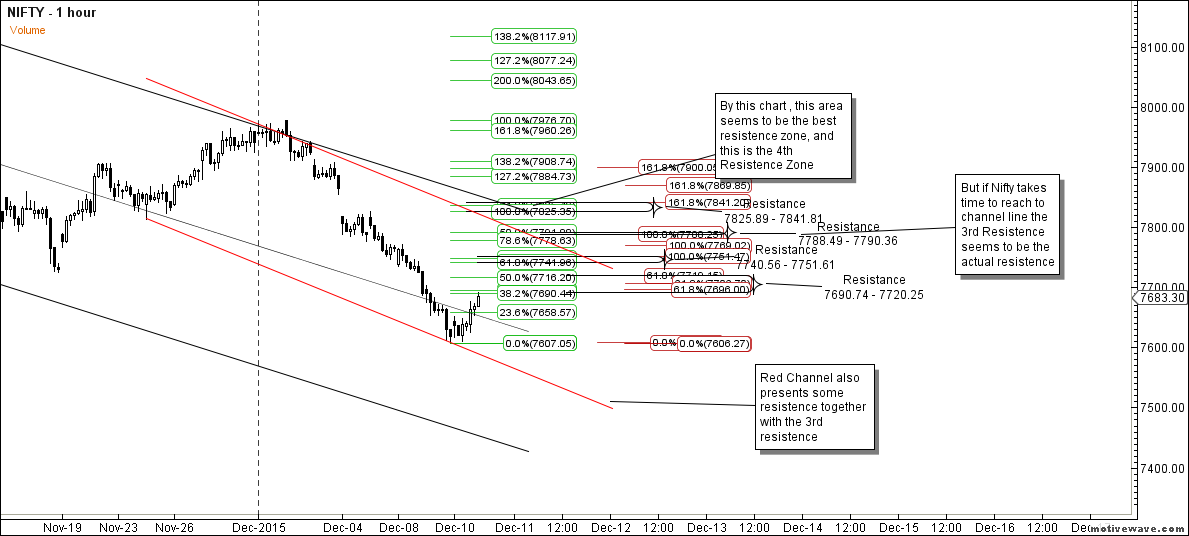
The First Chart is showing the bigger picture of where the Supports are located, while the 2,3,4 Charts show the smaller picture of where can Nifty face Resistance. As per Gann Analysis Nifty is yet to find the Bottom.


1 comments:
Shares of Tata Power Company rose 2.2 percent intraday Wednesday as the Tata Group company is likely to see reduction in interest cost post refinancing of rupee loans.
natural gas tips
Post a Comment